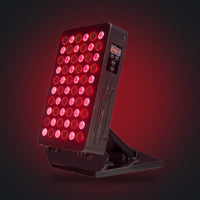
Red Light Panel Distance Chart for Common Panel Sizes
Published October 2026. Updated October 2026.
Quick answer
Here is a distance chart built from AWA stated irradiance. The FX300 is listed at 1, 2, 3, 6 and 12 inches. The FX500 is listed at ten distances from 2 to 20 inches. Each row shows the stated mW/cm², the share of the 6 inch figure, and an arithmetic energy figure for 5 and 10 minutes. The chart shows what the devices emit at each distance. It is not a session plan, and your manual sets time and distance.
How to read a distance chart
A distance chart pairs each distance with the stated irradiance for that distance. Irradiance is power per square centimeter, written in mW/cm². If that term is new, see what irradiance means. The columns we add are plain arithmetic using the dose formula J/cm² = mW/cm² x seconds / 1000.
The stated numbers come from the AWA irradiance specs guide. There is also a live irradiance by distance chart page. Use whichever format you prefer, but keep the numbers matched to your own panel.
FX300 distance chart
| Distance | Stated (mW/cm²) | Share of 6 inch figure | 5 minutes (J/cm²) | 10 minutes (J/cm²) |
|---|---|---|---|---|
| 1 inch | 220 | 263 percent | 66.0 | 132.0 |
| 2 inches | 145 | 174 percent | 43.5 | 87.0 |
| 3 inches | 116 | 139 percent | 34.8 | 69.6 |
| 6 inches | 83.5 | 100 percent | 25.1 | 50.1 |
| 12 inches | 43.3 | 52 percent | 13.0 | 26.0 |
FX500 distance chart
| Distance | Stated (mW/cm²) | Share of 6 inch figure | 5 minutes (J/cm²) | 10 minutes (J/cm²) |
|---|---|---|---|---|
| 2 inches | 220 | 234 percent | 66.0 | 132.0 |
| 3 inches | 197 | 210 percent | 59.1 | 118.2 |
| 4 inches | 149 | 159 percent | 44.7 | 89.4 |
| 5 inches | 121 | 129 percent | 36.3 | 72.6 |
| 6 inches | 94 | 100 percent | 28.2 | 56.4 |
| 7 inches | 91.1 | 97 percent | 27.3 | 54.7 |
| 10 inches | 81.4 | 87 percent | 24.4 | 48.8 |
| 12 inches | 73.8 | 79 percent | 22.1 | 44.3 |
| 15 inches | 70 | 74 percent | 21.0 | 42.0 |
| 20 inches | 58.6 | 62 percent | 17.6 | 35.2 |
Stated irradiance is AWA published data. Energy columns are arithmetic only and are not recommended session lengths.
What the chart tells you
- The FX500 curve is flatter in the middle. Between 7 and 15 inches the stated figure moves only from 91.1 to 70, a drop of about 23 percent over eight inches.
- Close range is steep. On the FX500 the figure goes from 220 at 2 inches to 149 at 4 inches, a drop of about 32 percent over two inches.
- The FX300 is listed at fewer points. Its jump from 6 to 12 inches has no published value between them, so a distance such as 9 inches would be an estimate.
- A listed distance is a checked distance. Pick one from the chart so every number in your arithmetic is a stated one.
Same energy at different distances (arithmetic only)
If you wanted a different distance to match the energy of 10 minutes at 6 inches, how many minutes would the arithmetic need? This is a thought exercise about the formula, not a session plan.
| Panel and distance | Minutes to match 10 minutes at 6 inches |
|---|---|
| FX300 at 1 inch | 3.8 |
| FX300 at 3 inches | 7.2 |
| FX300 at 12 inches | 19.3 |
| FX500 at 2 inches | 4.3 |
| FX500 at 4 inches | 6.3 |
| FX500 at 12 inches | 12.7 |
| FX500 at 20 inches | 16.0 |
The point of the exercise is to show how quickly time and distance trade off. It does not mean any of these lengths is appropriate for you. Follow your manual, and use the session time table only as a reference for what the manual states.
How panel size changes your own chart
We publish numbers for our own devices only. If you own a different panel, the shape of its chart depends on its size and LED layout. A larger panel tends to hold its figure better as you step back, because more of its surface is within reach. A smaller panel falls off sooner. Your panel's own spec sheet is the source for its own numbers. If it gives only one figure with no distance, you cannot build a chart from it.
You can make a simple chart of your own device in four steps:
- Copy the stated irradiance and the distance it was stated at.
- Pick two or three distances you can realistically use in your room.
- Ask the maker for the stated figures at those distances. If none exist, regard anything else as unknown.
- Run the dose arithmetic for the times your manual gives.
Using the chart in a real room
Say your room only allows an FX500 to sit about a foot from where you stand. The chart gives a stated 73.8 mW/cm² at 12 inches, so a 10 minute run works out to 44.3 J/cm² of arithmetic. If you move to 6 inches, the same 10 minutes works out to 56.4 J/cm². Neither number is a target. What the chart does is let you see that your choice of distance is also a choice about energy, and that picking a spot and keeping it makes your sessions easy to compare. Write the distance on a piece of tape on the floor, and the chart will always match what you did.
Common mistakes
- Reading across a row and assuming the energy columns are what you should do.
- Using the FX300 row for an FX500, or the reverse. The two panels have different numbers.
- Interpolating between listed distances and calling the answer a stated figure.
- Printing the chart without noting the units. mW/cm² and J/cm² are different things.
- Forgetting that a chart assumes you hold the same distance for the whole session.
Before you use any light device: read the label, follow the device manual, and use eye protection as directed. For medical questions, speak to a qualified health professional first.
Related guides in this series
- What irradiance means on a spec sheet
- AWA FX300 and FX500 irradiance specs
- Dose formula: irradiance, time and energy
- FX300 vs FX500: the quick answer
This post is part of our distance and placement series. Start with the red light therapy distance guide for the overview.
Device pages
Read the full page and label for each device before you use it: AWA FX300 panel and AWA FX500 panel. You can also browse AWA panels.
Frequently asked questions
Where do the numbers in this chart come from?
The stated irradiance values are AWA published figures at each listed distance. The energy columns are our arithmetic using J/cm² = mW/cm² x seconds / 1000.
Can I use the FX500 chart for another brand?
No. Each panel has its own LED layout and output, so a chart only describes the device it was published for.
What if I stand between two listed distances?
Any figure between two published numbers is an estimate. Move to a listed distance if you want to calculate with stated values.
Does a higher number on the chart mean a better setup?
No. A higher number only means more power per square centimeter at that distance. Your manual sets time and distance.
Is there an interactive version?
Yes, the irradiance by distance chart page on this site lists the same stated figures.
Sources
- FDA: General Wellness policy for low risk devices. January 2026 guidance describing general wellness products as low risk products that promote a healthy lifestyle. It is a policy document, not a statement about any one device.
- FDA: Laser Products and Instruments. Explains laser hazard classes I to IV and labeling, and notes that LEDs are not subject to the federal laser product performance standard.
Regulatory note: select devices carry FDA 510(k) clearance for specific, limited uses. Most light devices are sold as general wellness products. Read each product page and label.
How we create this guide
AWA sells red light therapy devices. We write these guides to explain how devices work and how to choose and use one. This is general information, not medical advice. Read each product page and label. See our editorial standards.